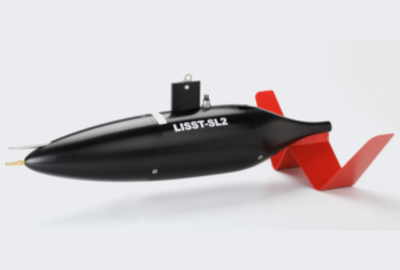
Suspended Sediment
Sequoia Scientific LISST-SL2
Delivers real-time Point-Integrated, Depth-Integrated, or time-series data. Replaces old technology samplers.
The streamlined body is a minimum drag shape. In measures depth, velocity, temperature, concentration and size distribution of sediments and other auxiliary parameters. Based on laser diffraction.
The system employs active control of an intake pump that matches intake velocity to river velocity (iso-kinetic). [The features section below lists new features.]
- The LISST-SL2 has a greatly simplified user interface compared to the original LISST-SL.
- Uses laser diffraction; new: redesigned optics cover expanded grain size range, 1-500 microns (from 2-386 microns for LISST-SL)
- Isokinetic; new: advanced pump control.
- 2-wire special communication protocol consistent with USGS B-reel use.
- Topside Box (TCB) contains batteries, and transfers data to laptop computer using blue tooth.
- Display on computer shows battery life remaining, and issues warning when low.
- Real-time display: Current speed, temperature, concentration, grain size distribution, depth, mean sediment grain size.
- New: software delivers point-integrated and depth-integrated sediment data.
- Blue-tooth data link permits operation out of weather.
- Switch between ft and ft/s or m and m/s for depth and velocity units.
- Real-time data processing permits time-series or vertical profile format for all data.
- Easier storage and maintenance after use.
-
A major difference between the LISST-SL2 and other LISST instruments is that the LISST-SL2 is only a sensor. It cannot operate autonomously and no data can be stored on the instrument itself. The LISST-SL2 must be connected using a USGS B-Reel to a Topside Control Box (TCB). The TCB contains a rechargeable battery and electronics. It supplies power down the B-Reel cable to the LISST-SL2, and receives the raw scattering data from the LISST-SL2. These data are transmitted via blue-tooth to a nearby laptop, or tablet (Windows only). Using the computing power of the laptop, raw data are processed on the laptop in real-time, and all results are displayed [e.g. optical transmission, velocity, depth, temperature, particle size distribution, total concentration…]. The operator can choose time-series view, or vertical profile view. Post processing software generates point-integrated or depth-integrated concentrations – thus providing data that has historically been collected laboriously with bottle samplers. In addition, when concentrations are combined with velocity data, sediment flux (transport rate) is also obtained. The data are so rich that interested scientists may easily obtain flux of particles in 36 distinct size classes!
All data, raw and processed, are output in user-friendly formats.
